Time to Conversion: Reading the Lag Between First Touch and Sale

We obsess over how many people convert and where they convert, but we rarely ask how long it took them to get there. Time to conversion — the elapsed time between a visitor’s first interaction and the moment they convert — is one of the most underused reports in analytics. And it quietly explains a lot of behavior that conversion counts can’t.
I lean on time-to-conversion data whenever a funnel looks “fine” on paper but revenue feels slow. It tells you whether your sales cycle is a same-session sprint or a three-week marathon — and that single fact reshapes how you read every other report. It fits naturally alongside broader funnel analysis, adding a time dimension to the steps you already track.
What Time to Conversion Measures
Time to conversion (also called conversion lag or time lag) measures the duration of the journey from first touch to conversion. Most analytics tools report it as a distribution — a breakdown of how many conversions happened within zero days, one day, a week, a month, and so on.
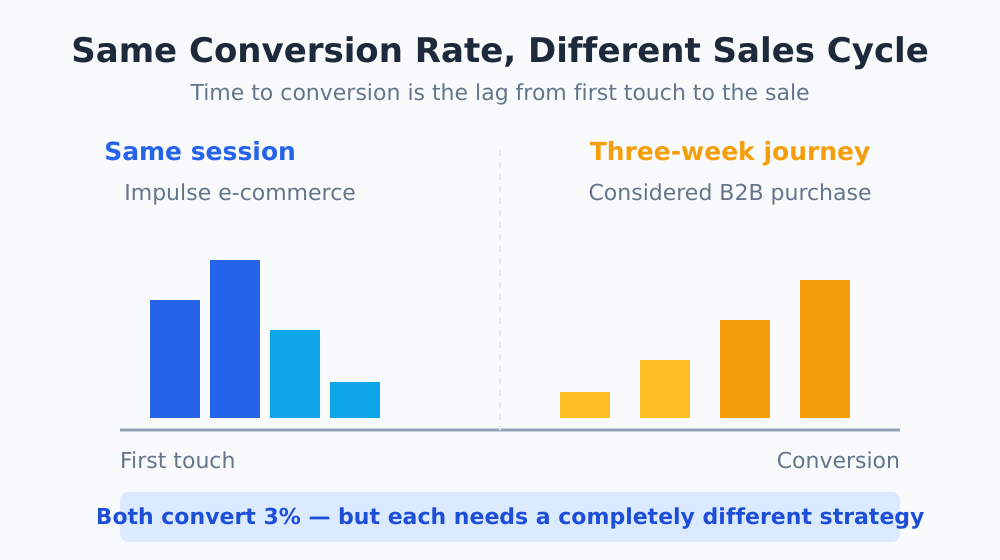
The reason it matters is simple: the same conversion rate can hide wildly different sales cycles. Two sites might both convert 3% of visitors, but if one does it in minutes and the other over three weeks, they need completely different marketing strategies.
| Time-Lag Profile | Typical Business | What It Implies |
|---|---|---|
| Same session | Impulse e-commerce, low-price digital | Optimize the immediate experience |
| 1–7 days | Considered purchases, mid-price SaaS | Retargeting and follow-up emails pay off |
| 2–8 weeks | B2B, high-ticket services | Nurture content and multi-touch matter most |
| Months | Enterprise deals, major investments | Long-term brand and relationship building |
Why the Time Dimension Changes Your Decisions
When you ignore time, you implicitly assume everyone converts on a similar timeline — and you optimize as if conversions happen quickly. That assumption leads to predictable mistakes.
- Killing campaigns too early. If your real sales cycle is three weeks but you judge a campaign after three days, you’ll cut winners before they’ve had time to convert.
- Underrating top-of-funnel content. The blog post someone read in week one rarely gets credit for the purchase in week four — unless you understand the lag and look for it.
- Mismatched follow-up timing. Knowing that most conversions land on day five tells you exactly when a reminder email or retargeting ad will do the most good.
Conversion rate tells you if people convert. Time to conversion tells you when — and “when” is what determines your budget patience, your follow-up cadence, and how much credit your awareness content deserves.
Where to Find Time-Lag Data
Most mature analytics platforms expose this. Google Analytics 4 reports conversion paths and timing, building on concepts from the older Multi-Channel Funnels time-lag report — Google’s attribution documentation explains how conversion paths and timing are modeled. Many CRM and marketing tools track time-to-close on the deal side, which you can reconcile against your web data.
If your tool doesn’t offer a native time-lag report, you can derive it: capture a timestamp on first visit (stored in a first-party identifier) and a timestamp at conversion, then compute the difference. The mechanics depend on your stack, but the principle is universal — you need a stable way to recognize a returning visitor, which is also why cross-domain tracking matters if your journey spans multiple domains.
How to Read a Time-Lag Report
When you open a time-to-conversion distribution, here’s the order I read it in.
1. Find the Center of Gravity
Where do most conversions cluster? If 70% happen in the first session, you’re running a fast-cycle business and should pour effort into the on-page experience. If conversions spread across weeks, you’re in nurture territory.
2. Look at the Long Tail
Pay attention to conversions that take a long time. A meaningful tail of 14-plus-day conversions means your attribution window needs to be long enough to capture them — otherwise you’ll under-credit the channels that started those journeys.
3. Compare Across Segments
Time lag often differs sharply by channel and by product. Paid search might convert fast while organic content converts slowly. Segmenting the report turns a single average into an actionable map of how each channel actually performs.
| What You See | Likely Meaning | Action |
|---|---|---|
| Most conversions same-session | High-intent, fast decision | Optimize landing page & checkout |
| Spike around day 3–7 | Follow-up window | Time emails / retargeting here |
| Long, flat tail | Extended consideration | Extend attribution window, nurture |
| Bimodal (two clusters) | Two distinct audiences | Segment and treat separately |
Connecting Lag to the Rest of Your Analysis
Time to conversion is most powerful when it informs other reports rather than standing alone. It sets the right attribution window, so your attribution models capture the full journey instead of clipping it short. It calibrates how patient you should be when judging campaigns. And it tells your funnel where the slow steps are — the stages where people stall before moving on.
One report I always cross-reference is funnel drop-off analysis. If a step has both high drop-off and a long time lag, that’s a stage where people get stuck and drift away — a prime candidate for a follow-up touch or a friction fix.
Common Pitfalls
- Too-short attribution windows. If your window is 7 days but real journeys take 30, your time-lag data is truncated and misleading.
- Averaging instead of distributing. A single “average days to convert” number hides bimodal behavior. Always look at the full distribution.
- Ignoring the offline gap. For B2B, the real decision often happens in meetings your analytics can’t see. Reconcile web lag with CRM close time.
The Bottom Line
Adding the time dimension to your analysis is one of those changes that costs almost nothing and reframes everything. Once you know how long your conversions really take, you stop judging campaigns on the wrong timeline and start timing your follow-ups to match reality.
Pull your time-lag report, find where conversions cluster, and let that shape your attribution window and your patience. For the bigger picture of how steps and timing fit together, my complete funnel analysis guide is the place to start.